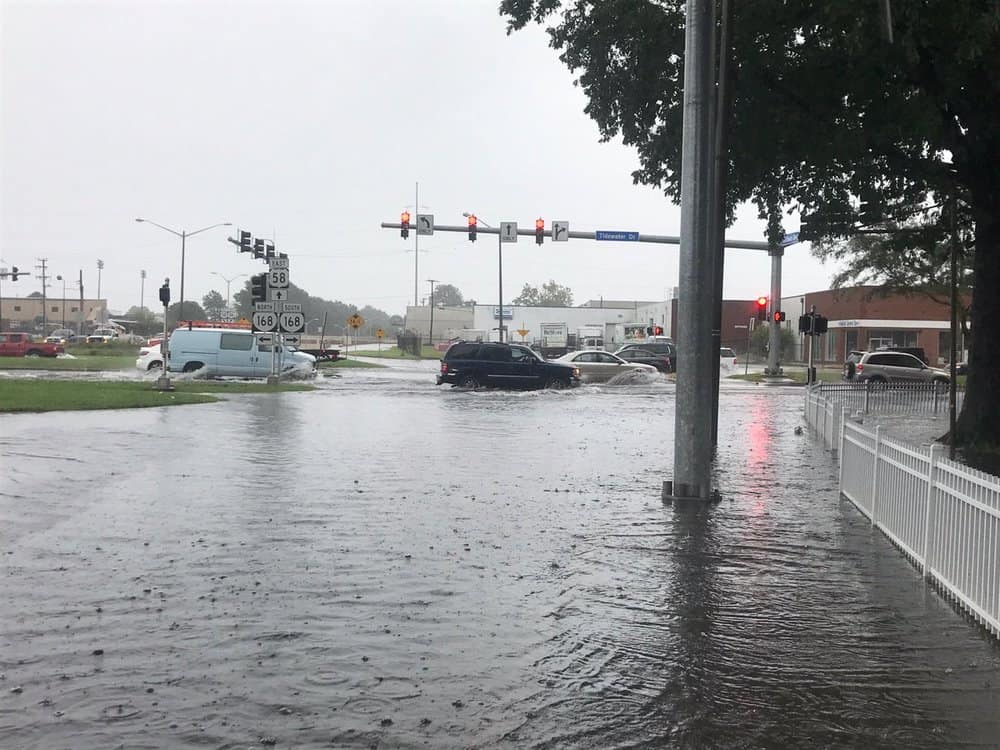
A new water quality monitoring station in Norfolk is about to make a big difference in water quality management and improvement. This station will provide real-time data on factors such as salinity and dissolved oxygen every 15-minutes all year long.
According to Joe Rieger, Deputy Director of Restoration for the Elizabeth River Project (ERP), “The Department of Environmental Quality (DEQ) takes samples from waterways about once a month. These occasional samples can vary widely and are greatly affected by the weather. A heavy rain the night before a DEQ sample will change the results. This new station will sample the water every 15 minutes. We will be able to precisely monitor how water quality changes with the weather and seasons. We will get a much improved report of the water quality, and how the weather and humans affect it.”
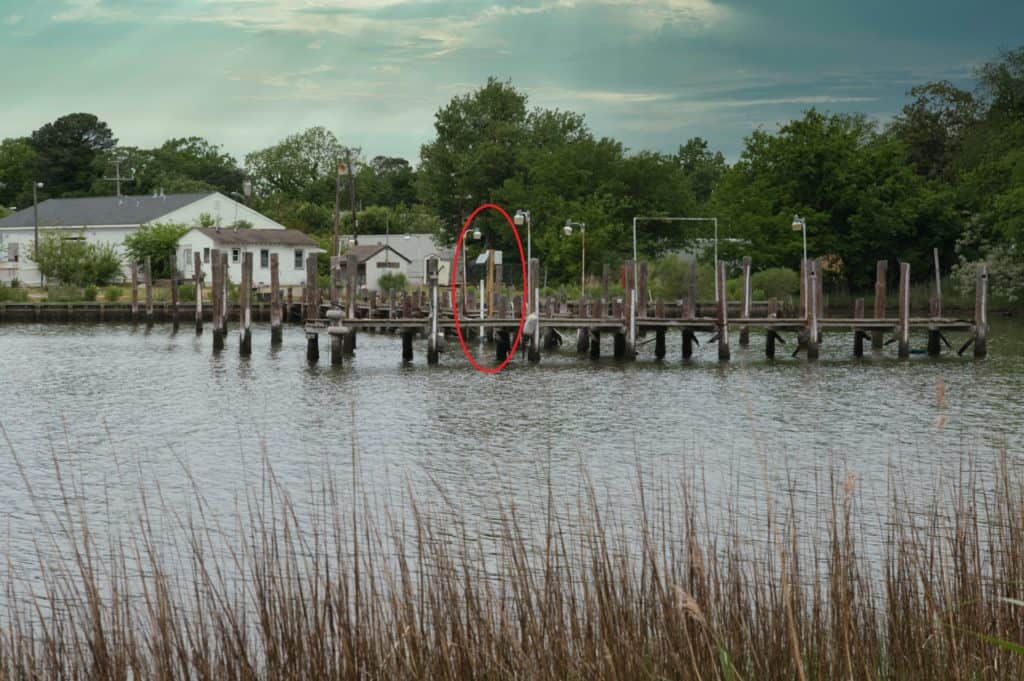
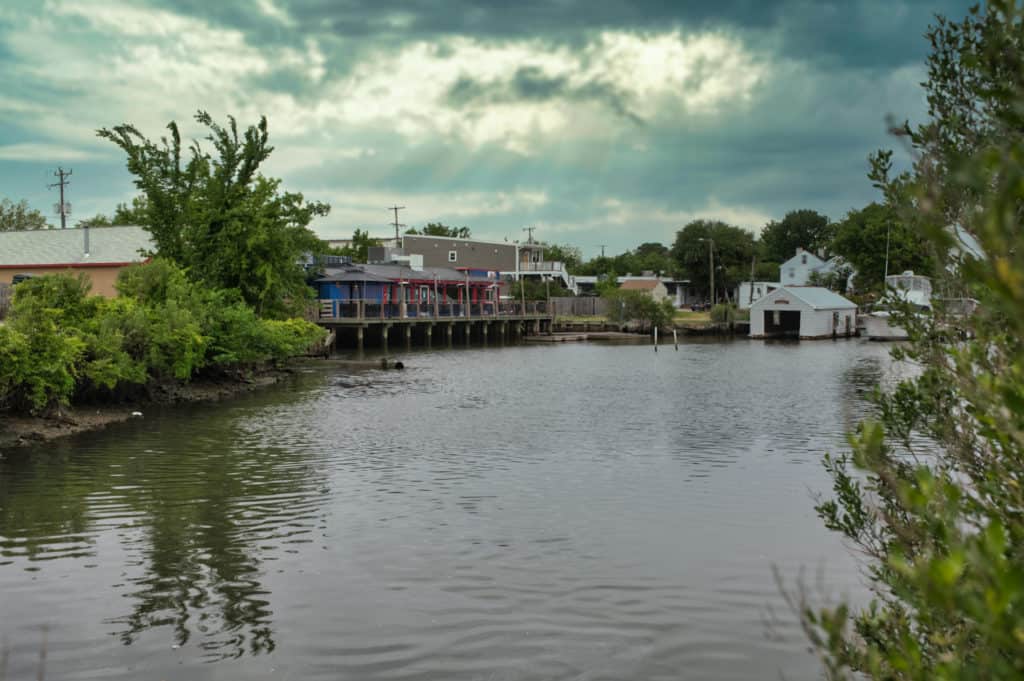
This new station is part of the ERP’s Pru and Louis Ryan Resilience Lab. As Bay Bulletin reported in March, the lab is made possible by a $2.1 million gift from the Ryans. The facility will showcase climate change-resistant living, with features such as solar power, rain barrels, and green roof. It will incorporate floating platforms and storage buildings that rise with flooding. The entire building will be elevated 10 feet above the ground. The location on Knitting Mill Creek provided the perfect location for this state-of-the art monitoring station.
Knitting Mill Creek, which parallels Colley Avenue in Norfolk, is heavily urbanized. Named after a knitting mill that was built in the 1800s, and still stands nearby, the creek is definitely impaired. The data provided by this facility will provide instant feedback to water quality improvement efforts in a city environment.
This summer, two interns from Norfolk State University will be maintaining the equipment and tabulating data. They will make sure the sensors that check dissolved oxygen, ph, salinity, turbidity, and bacteria are working properly.
In the near future, the ERP plans to add basic meteorology sensors and a tide gauge at the same location. A second full monitoring station will also be installed on the ERP’s learning barge. The data is available on line, though the site is oriented more toward the scientific community than to the causal weather buff. If you follow this link then click the “Table View” tab, it will all be there for your own scientific analysis.
–Kendall Osborne